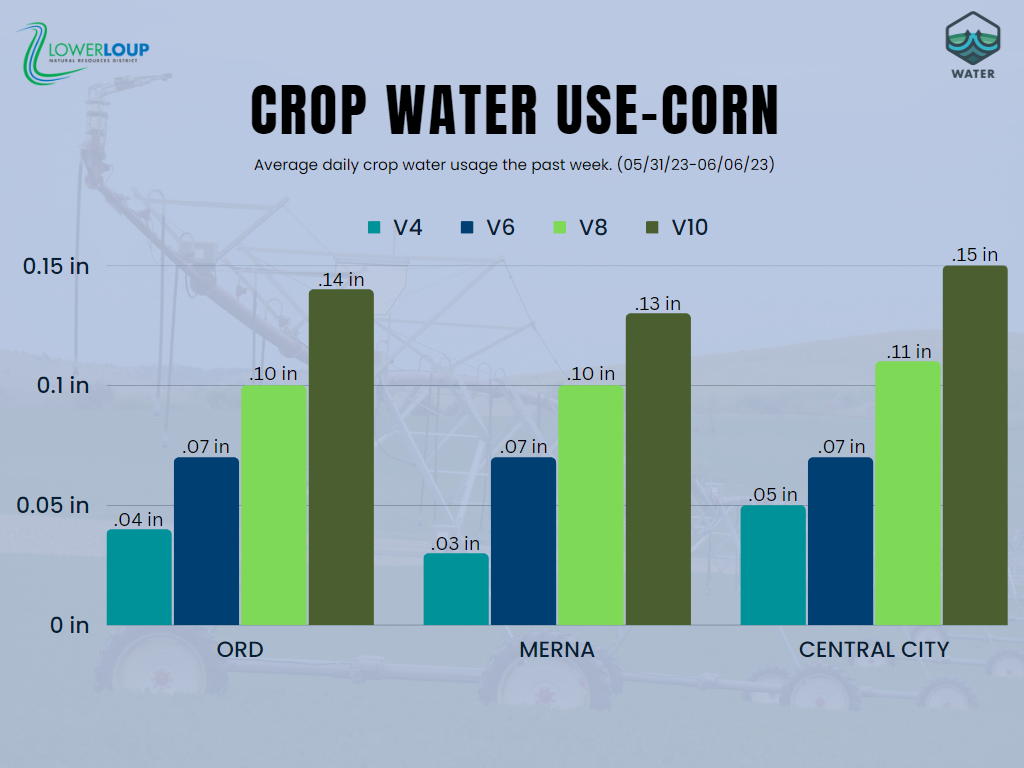
The Lower Loup NRD has updated its Crop Water Use Report format. The updated layout consolidates data from three automated regional weather stations within the High Plains Regional Climate Center network into useful infographics updated every Wednesday through the growing season.
The updated report gives average daily water use data for corn, soybeans, and potatoes with a series of easy-to-read graphs. Each graph displays the water use of the crop at four different growth stages so they can be used by producers no matter when they planted. This data can be used by producers to estimate how much to irrigate in the upcoming week.
View these reports by visiting LLNRD.org, going to the Resources tab, and clicking on Crop Water Use.
